

If you have a need for a graphical hierarchical list, org chart or flowchart for a PowerPoint presentation, you could create it manually. Or you can just type out a list and then use SmartArt in PowerPoint to create it for you. Here’s how you do it.
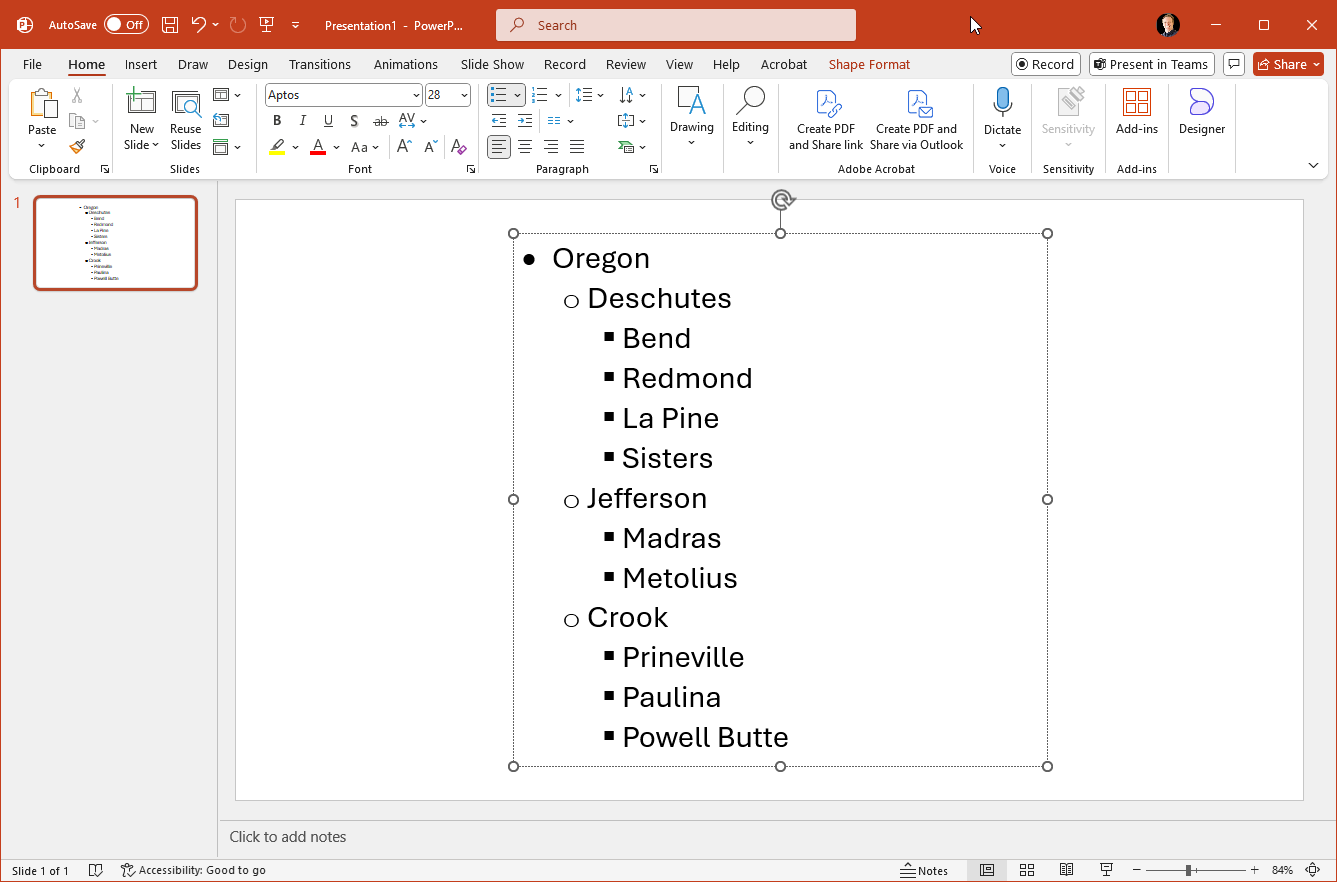
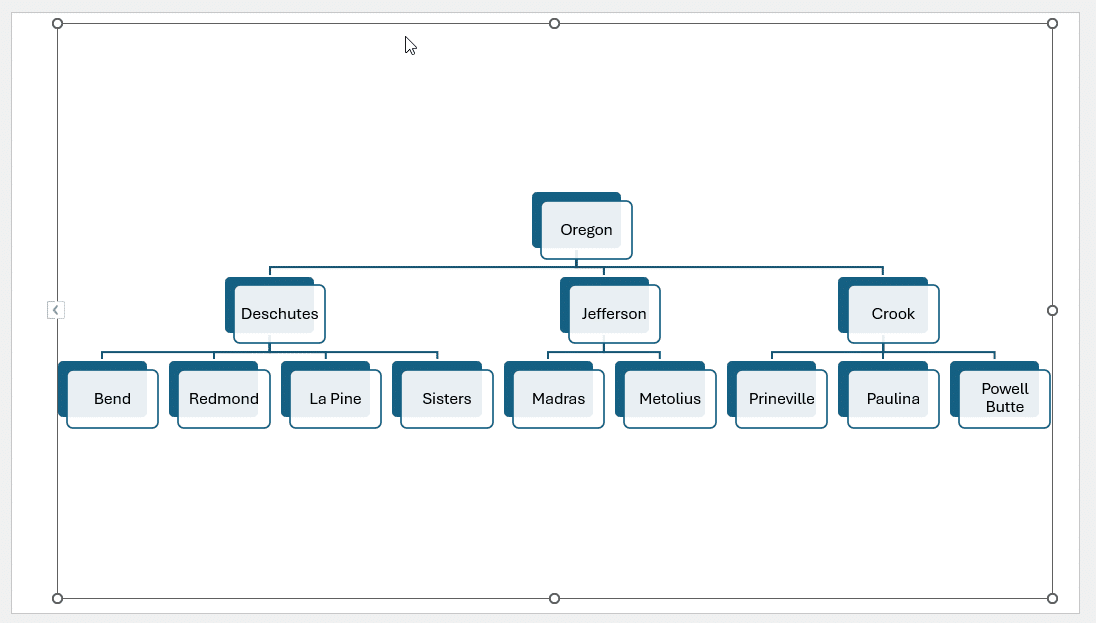
First off, create a properly-indented list of the data you want in your chart. In this case, we’re using our state, then counties, and then some towns within those counties. But you could easily use it for an organization chart or hierarchy within your company.
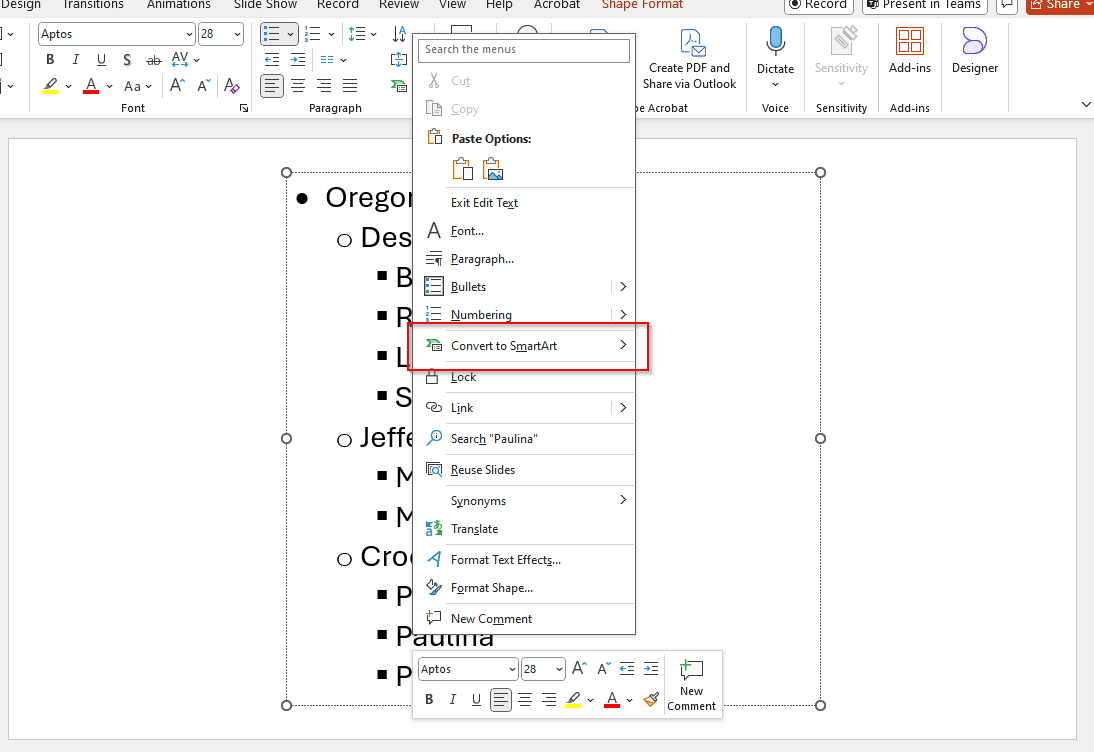
Right-click on the text box for the list, and select “Convert to SmartArt”
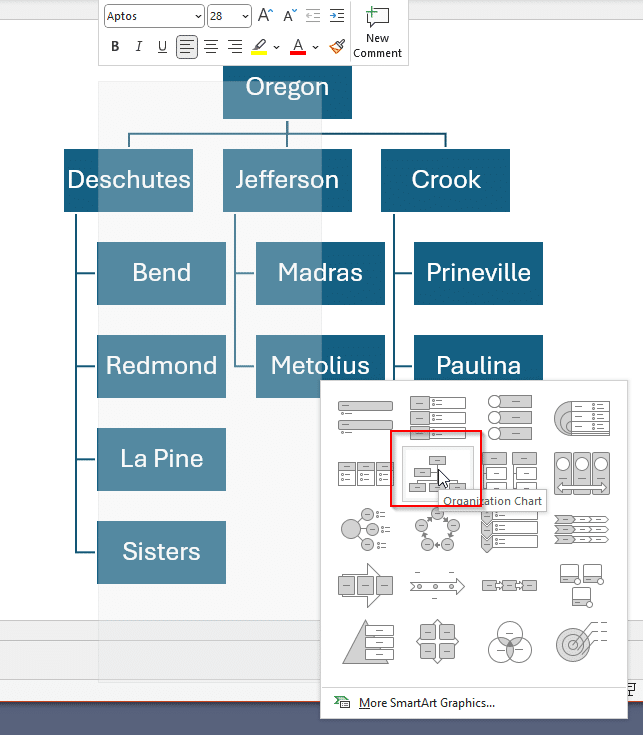
You can move your mouse over the examples there to see what the list will turn into. In this screenshot, we used the organization chart option:
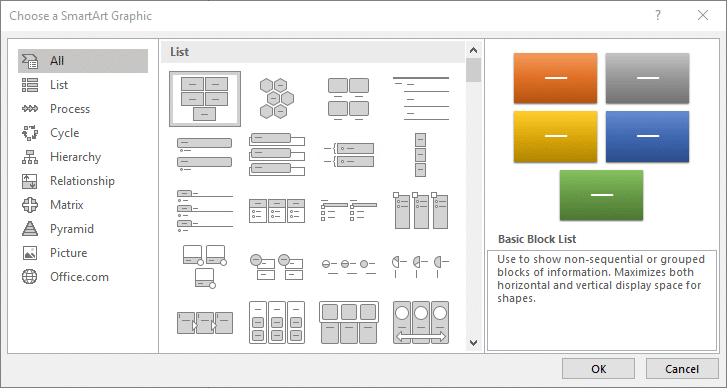
If you don’t like the quick options, you can go into the “More SmartArt Graphics…” link:
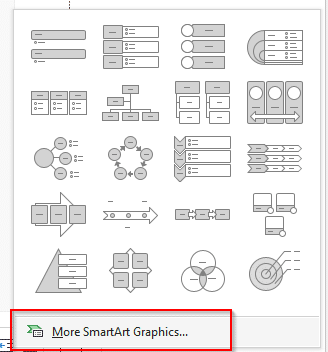
And get all sorts of list, process, cycle, hierarchy, and many more SmartArt options.
And you can do all sorts of fun stuff with your list:
SmartArt is a feature built into PowerPoint, Word, and other Office apps. You can read more about SmartArt on Microsoft’s website or watch a video on creating and changing SmartArt to see what it can do to liven up your documents.